Blog
Waste Collection Management During Natural Disasters: What Resilient Cities Do Differently
by Katie Kinnear • July 7, 2026
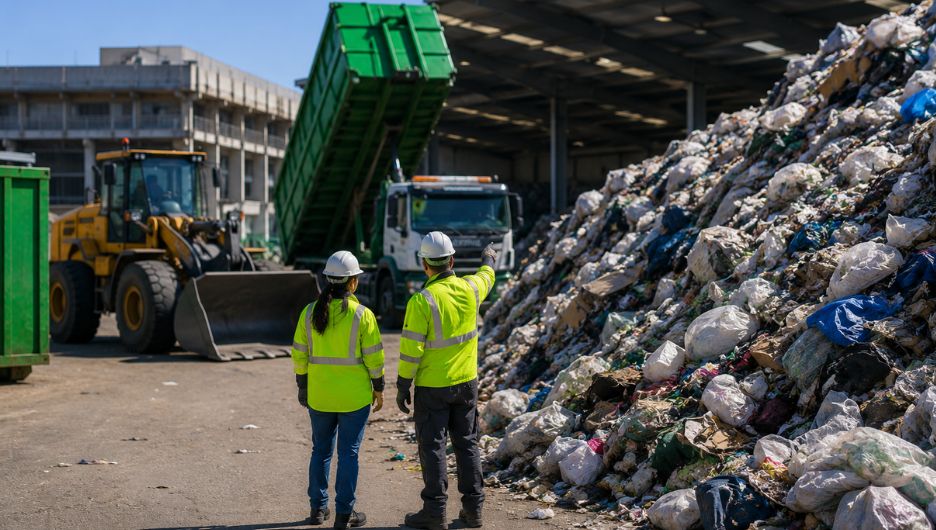
Most cities have a detailed plan for the storm itself. Far fewer have one for the days after, when the water recedes or the snow stops and the cleanup begins. Emergency response gets the upfront attention, but cleanup is what determines how quickly a community returns to normal.
That recovery phase is where waste collection management pivots from a routine service into a frontline operation. Within hours, a city can face thousands of tons of debris, a service-request backlog that grows by the hour, and residents waiting for help to arrive. What separates the cities that clear it in weeks from the ones that take months is rarely the size of the fleet. It is whether the right systems for mapping, routing, and data were already in place before the storm hit.
The clearest way to see that difference is through two cities that faced it head-on this past year. The City of Milwaukee, WI , worked through a thousand-year flood that knocked out both of its transfer stations; and the City of Washington, D.C., dug out from an ice storm severe enough that crews needed pickaxes to break the ground. Their operations leaders detailed their strategic responses in a recent Routeware SmartCity webinar, and the approaches they describe are worth a closer look.
Key Takeaways:
- Smart waste collection management turns disaster response from reactive to proactive. When mapping, routing, and 311 data work as one connected system, a city can see where the damage is concentrated and direct crews in real time instead of guessing from static maps.
- Real-time density mapping is what makes a large-scale cleanup manageable. Live heat maps let public works teams prioritize the hardest-hit areas and deploy limited equipment where it counts, which sits at the core of waste management in smart cities.
- Flexibility beats fixed routine in a crisis. The cities that recover fastest reorganize collection by geography, add capacity where it is needed, and reroute on the fly rather than clearing a backlog in the order requests came in.
- Preparation before the storm decides the speed of recovery. A single source of truth across GIS, 311, and collection systems lets a city scale its everyday operations into an emergency response without inventing new workflows under pressure.
Inside the City of Milwaukee’s Thousand-Year Flood Response
In August 2025, Milwaukee received more than 14 inches of rain in under 24 hours, a total that set a Wisconsin state record and caused widespread flash flooding across the Milwaukee, Menominee, and Kinnickinnic river systems. The northern neighbourhoods were hit hardest, where some residents found three to four feet of water in their homes and raw sewage backing up into their basements.
The bigger problem was that the city’s waste management infrastructure was overwhelmed at the same time. Both transfer stations went down from a combination of flood damage, power loss, and failed compactors, and with the tipping floors already full, crews had to dump material in parking and driving lanes simply to free up their trucks. With no local site to take the waste, the operation shifted to direct-to-landfill hauling, which added an hour to an hour and a half onto every trip.
To regain control, the sanitation team organized its work around five pillars: operations, equipment and facilities, communication, logistics and strategy, and technology. The equipment effort alone shows the scale involved. Milwaukee deployed more than 50 of its own heavy machines and brought in another 45 pieces through three contract partners, running Prentice loaders, rear load packers, skid steers, trackless plows, quad axle dump trucks, and open top dumpsters all at once. They moved debris using a method the crews called the “plow the block” technique, where small plow tractors pushed material off the curb lawns into the street, skid loaders and end loaders scooped it up and dropped it into 20-yard dumpsters, and street sweepers followed to reset each block. By the time the work was finished, they had cleared more than 11,000 tons of material.
How Milwaukee Used Waste Collection Routing Software to Map the Damage
Heavy equipment cleared the debris, but the technology coordinating the response is what enabled Milwaukee to recover so quickly, and that came down to groundwork laid long before the flood.
The city was only about a month into its Routeware rollout when the storm arrived, so the tools were still new to the team. Before that, route planning ran on large city maps divided into quarter sections, an approach that works on a normal week but falls apart when conditions change by the hour across half a city. The advantage came from a structure the city had already built. Milwaukee had established Esri as its single source of truth for location data, which meant it could pull mapping, routing, and operational data during the emergency without inventing new workflows mid-response. Resident calls flowed through the 311 call center into the city’s legacy work order system, which connected directly into Routeware SmartCity, giving field teams live visibility and helping dispatch assign locations to crews and close out work orders automatically.
From there, the most effective step was also one of the simplest. By reclassifying standard bulky waste requests in the 311 system into a dedicated flood debris category, the team produced live heat maps of the hardest-hit areas. The software rendered those at two zoom levels, a 1,000-foot density view for spotting the worst-affected areas and prioritizing resources, and a 100-foot density view for street-level coordination, both refreshing in real time. Instead of working from a static map, management could see exactly where the damage was concentrated and send crews accordingly.
Connecting the legacy system into the waste collection routing software removed a great deal of friction as well. It preserved existing operational knowledge, cut manual data entry, replaced the paper maps that slowed office-to-field communication, and automated the movement of service requests from the call center to the field. Milwaukee cleared the entire cleanup in just two months, where a comparable flood had previously taken four to six. Critically, the data captured along the way helped support a $195 million FEMA grant for households across Milwaukee, Waukesha, and Washington counties. Nick Taylor, the city’s business operations manager, walked through the full response, including the live dashboards, in the on-demand Routeware SmartCity webinar.
Inside Washington, D.C.’s Storm of the Century
Where Milwaukee contended with rising water, the City of Washington, D.C., faced the opposite extreme. In late January, the city was hit by seven inches of snow, followed by nine hours of sleet and three hours of freezing rain. The combination bonded into hard ice the crews called “snowcrete”, which standard shovels could not move, so teams had to use pickaxes. The temperature did not climb above freezing for ten straight days, the fifth longest such streak in the region’s history.
Crews ran 24-hour shifts for a full week to handle the snow removal operations themselves, but the harder challenge arrived after the snow stopped, in what city officials called the boomerang effect. Because bulk collection had been suspended for two weeks during the freeze, every missed pickup came back at once when service resumed, and the overdue requests piled up quickly in the system.
Rebuilding Collection Routes Overnight
Brendan Ford, a senior GIS and IT specialist for the city, led the recovery, and his first decision was to abandon the chronological approach. Rather than clearing requests in the order they arrived, he reviewed the full backlog at once and grouped it by geography, concentrating on dense clusters near ward boundaries and depots and running eight trucks instead of the usual six to clear those zones efficiently. When a stop could not be completed, dispatchers moved it to the next day on the digital board, so no resident was left out.
The pressure peaked in mid-February, when leadership issued an urgent directive to build eight new routes covering 5,000 missed trash and recycling requests, configure the mobile devices, and have eight crews trained and on the road by six the next morning. The team met the deadline using a documentation tool called Scribe to push rapid training guides directly to the crews’ phones. When those crews reached the neighborhoods, residents came out to flag trash that had never been reported, and it quickly became clear that 5,000 was an underestimate. So the city shifted to clearing entire alleys at a time. Using the delivery utility built into their waste collection software, administrators took an address point representing each alley, calculated the bulk service tied to it, and uploaded custom routes in bulk. The same planning discipline that helps cities optimize snow operations was applied directly to clearing the trash backlog.
Why Photo Verification Made the Difference
Clearing the alleys solved the logistics, but it also surfaced the single most valuable feature of the whole effort, which was the camera. The city runs an Open 311 integration that pulls citizen requests directly from Salesforce into the routing platform, and when a crew completes a stop, they take a photo that is logged into the 311 system for the resident to see.
That step proved more useful than anyone expected. As the cleanup dragged on and the political pressure mounted, those photos answered the repeated questions about why the work was taking so long. Photo evidence also shut down fraudulent claims, such as a resident reporting that a city truck had damaged their fence. As Brendan put it, in local government it rarely matters what you got done, only what you can prove you got done.
Getting Your Operations Ready for the Next Disaster
It would be easy to interpret these as stories of improvisation. Indeed,a fair amount of the work was built quickly out of necessity. But the cities that recovered fastest were not inventing their core response during the emergency. They had already connected their waste collection management systems and 311 data before the storm arrived. These cities’ tech-savvy, data-empowered approach to fleet operations resulted in smooth, transparent, and cost-effective storm recoveries.
The next severe weather event is a question of when, not if. The teams that handle natural disasters best utilize their daily tech stack as part of emergency planning rather than a back-office tool. To see the dashboards, the heat maps, and the field decisions in full, the complete account from Milwaukee and Washington, D.C., is available in the on-demand Routeware SmartCity webinar., and you can explore Routeware’s SmartCity to see how the same systems support everyday operations.
Frequently Asked Questions
Keeping waste collection running during a natural disaster depends on flexible routing and real-time visibility rather than fixed schedules. Cities that manage it well shift to geography-first deployment and use live data to send crews and extra equipment to the hardest-hit areas first.
Geographic prioritization clears more ground per truck than a first-in-first-out order. Grouping a backlog by location and concentrating crews on dense clusters of requests lets a city recover far faster than working through stops in the order they came in.
The most useful setup connects GIS, a 311 request system, and routing software into one platform. Together they give public works teams live heat maps, automated request handling, and the ability to build or change collection routes on the fly.
Photographic proof matters because in local government, proving the work was done is as important as doing it. Before-and-after photos tied to service requests reassure residents, answer complaints about delays, and protect the city against fraudulent liability claims.
The best preparation is a single source of truth that links mapping, 311, and collection data ahead of time. With that foundation already in place, a city can scale its everyday operations into an emergency response instead of building new workflows mid-crisis.
Yes. Geo-tracked records of where and when crews collected, along with before-and-after photos, help document the scale of a cleanup, which is the kind of evidence that supports a FEMA disaster grant application.
About the Author

Katie Kinnear
Katie Kinnear is Director of Brand Strategy at Routeware, where she leads brand, messaging, events, and communications efforts across the company’s full product suite. A 2024 Waste360 40 Under 40 honoree, she is passionate about advancing meaningful dialogue around circular solutions, smart city technology, and the future of waste and recycling. Katie serves on the boards of the Utah Recycling Alliance and Recycle Utah, extending her commitment to sustainability beyond the workplace and into her community.
 North America
  United Kingdom